
Introducing
PharmaCalc
The most efficient and accurate way to value pharmaceutical programs.
Featuring a simple and effective system
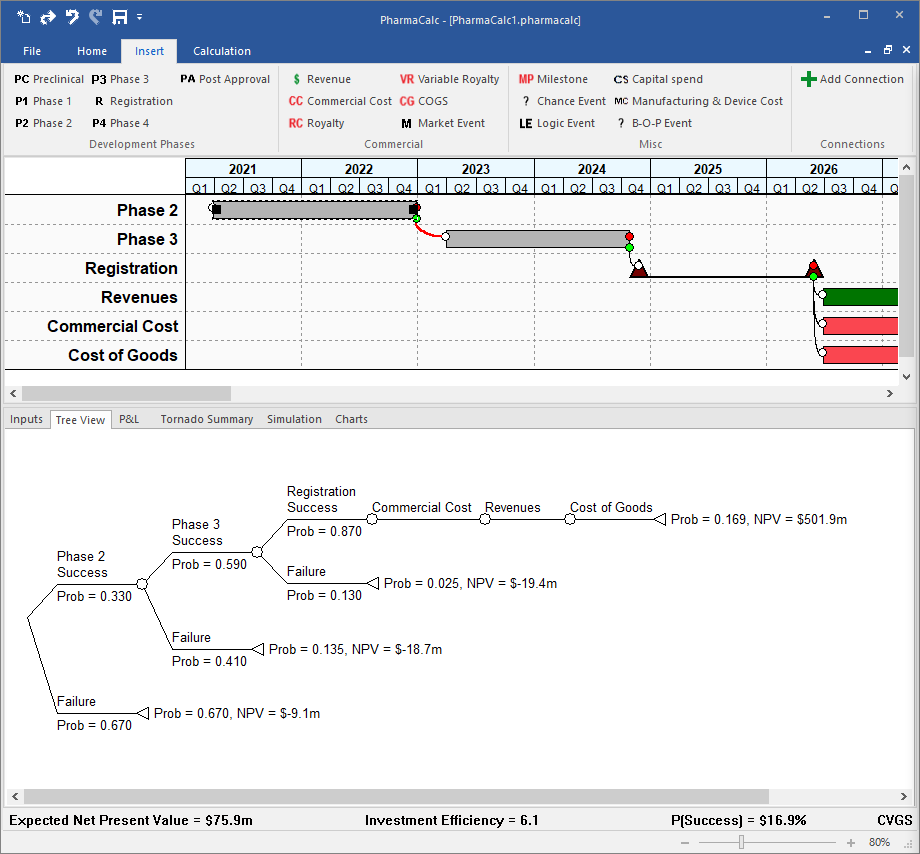
PharmaCalc is an intuitive way to quickly build valuation models for all types of pharmaceutical projects. It uses a simple Gantt chart metaphor where you easily draw a Gantt chart of your project to build your valuation model.
Features
Easy to use Gantt Chart Interface
Simple click and drag interface - as easy as using a drawing program
Connect events to build logic: i.e. connect the success result from a phase 2 clinical trial to trigger the initiation of a phase 3 trial
Enter inputs for each Gantt chart bar to inform the economic calculations
Automatic decision tree construction
As you build your Gantt Chart Model, PharmaCalc builds the model’s decision tree for you, based on the Gantt chart bars you entered and how you connected them
Full simulation capability
Easily build NPV vs. cumulative probability charts
Detailed P&L View
Multiple display options, copy and paste to a spreadsheet if needed
Automatic generation of tornado charts
Easily build tornado charts with a single click
Extensive charting capabilities
Build numerous types of charts that you can copy and export to other applications
Seamless integration with PharmaCalc Portfolio
Publish your PharmaCalc projects to a cloud repository for analysis by PharmaCalc Portfolio
Site licenses available – Contact Sales@AnalyticPowertools.com for details